← Back to Home

Close Orchestrator

FintechFinancial CloseConcept
Industry
B2B fintech, financial close
Year
2026
Role
Product designer, solo
Timeline
Concept, not shipped
Team
Figma, variables and components

→ Concept only. Not built or tested with real users.

Overview

Multi-country consolidation requires closing books in sequence. Some entities can't finish until others close. Intercompany balances need both sides settled first. Controllers find out about delays too late, only once they're already blocking downstream work.

Controllers coordinate this manually today. At Oracle NetSuite, I watched delays surface only after an entity was already blocking others. By then, options are gone.

Close Orchestrator flags which entities are likely to finish late, before the period starts. It suggests a close order based on dependencies, so controllers prioritize what matters. The accounting stays in the ERP.

Key Users

Group controller

Runs the close across all entities, decides the order, and chases entities that fall behind.

Entity accountant

Closes one entity and needs to know who is waiting on them, and by when.

UX Challenge

Too much to watch

A mid-sized group can have 20 or more entities, each with its own tasks and deadlines. A view that shows all of it leaves the controller to find the problems.

Predictions have to be believable

The controller is accountable for the close. If they can't check a flag, they'll double-check everything, and the prediction saves them nothing.

Two users, different stakes

The controller wants early warning. For an entity accountant, being flagged can feel like blame. The same data needs different framing for each.

The Process
Ground
01

Learning from existing close tools

I reviewed BlackLine, FloQast and Numeric. They handle task tracking and dependencies well. Most flag tasks that run slower once the close starts. I focused on predicting delays at the entity level before the period starts.

Frame
02

Mapping data and audiences

Close history, the dependency map, and task progress feed one prediction per entity. The controller sees it one way, entity accountants see it another.
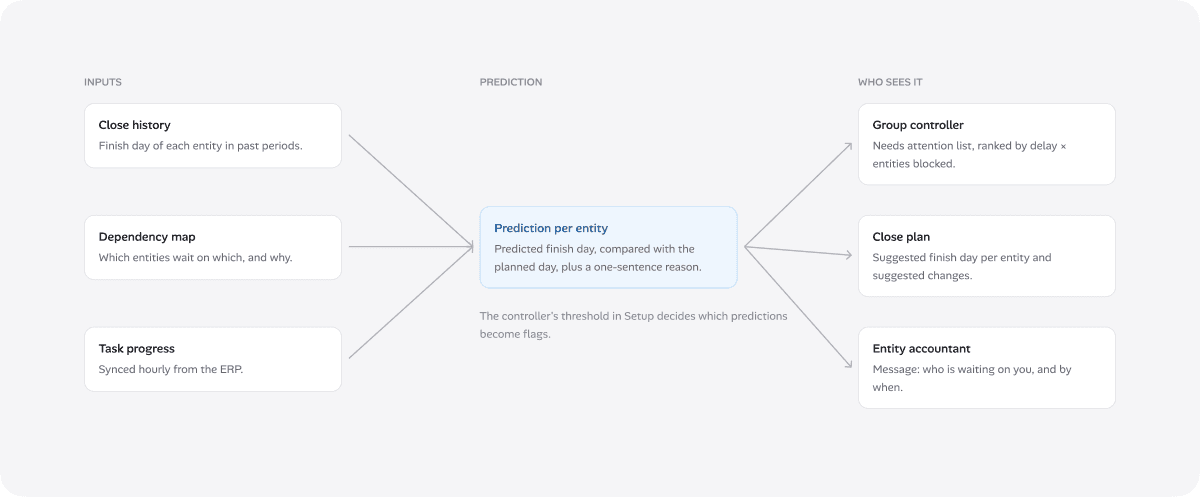
Data flow diagram: close history, dependency map, and task progress feeding one prediction and reason per entity
Simulate
03

From dashboard to triage list

I explored a full dashboard first: 22 entities across 8 countries. It was too much to scan. A triage list showing only flagged entities worked better.
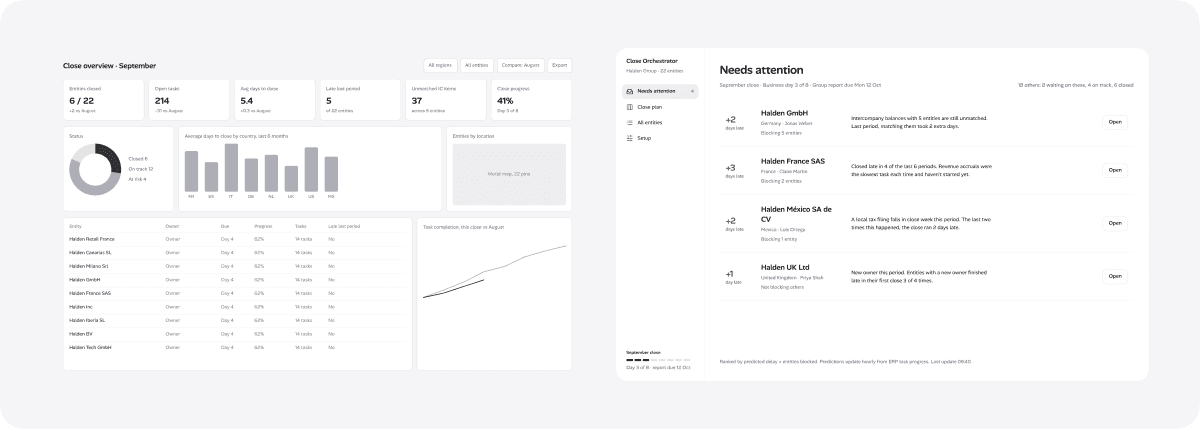
Rejected overview dashboard next to the triage list direction that replaced it
04

Four triage row explorations

I then tried four versions of the triage row.
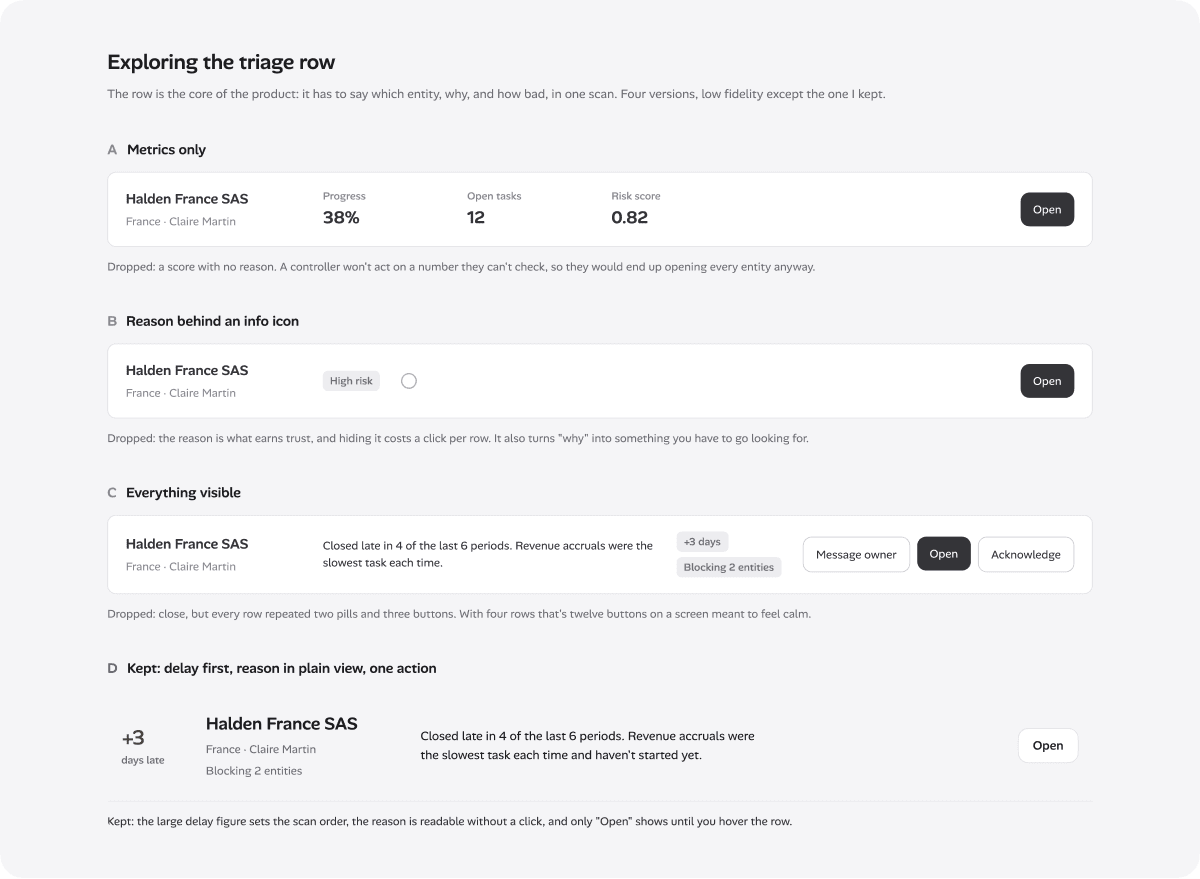
Four exploratory layouts for the triage row, comparing how much detail to surface per entity
Calibrate
05

Setting and testing the threshold

The controller sets how late counts as at risk. A backtest shows how the rule would have worked last period, including the late entities it would have missed, so the controller can decide how much to trust it.
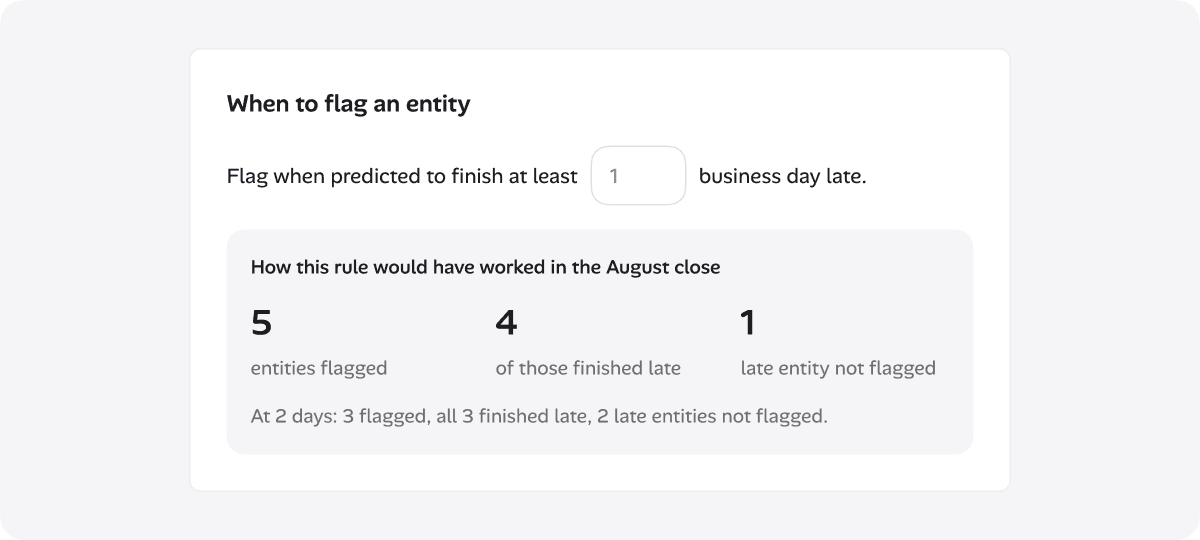
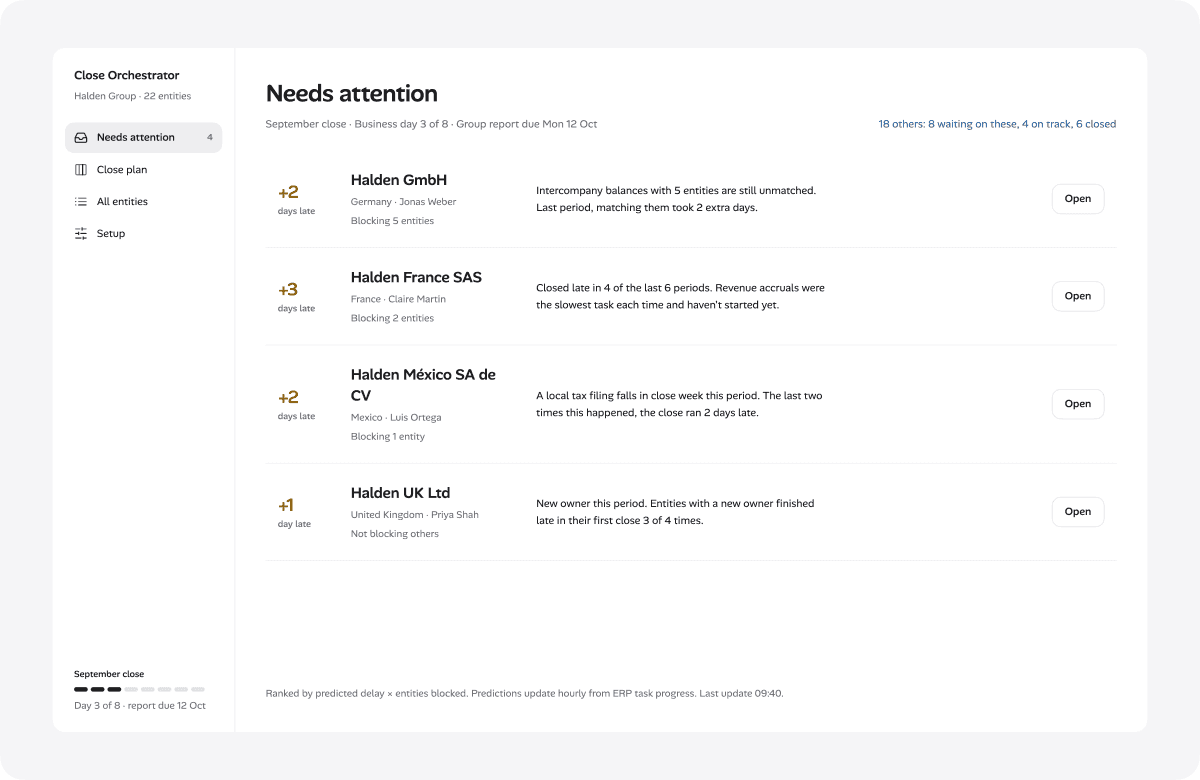
Threshold control and backtest view showing how the at-risk rule would have performed last period
Design decisions

Show only what needs action, not everything

Show only at-risk entities, ranked by delay size and how many others depend on them. Lead with the delay number so the urgency is instant. Don't show everything and make the controller filter it themselves.

Needs attention screen listing only flagged entities, ranked by predicted delay

Every flag needs a reason the controller can verify

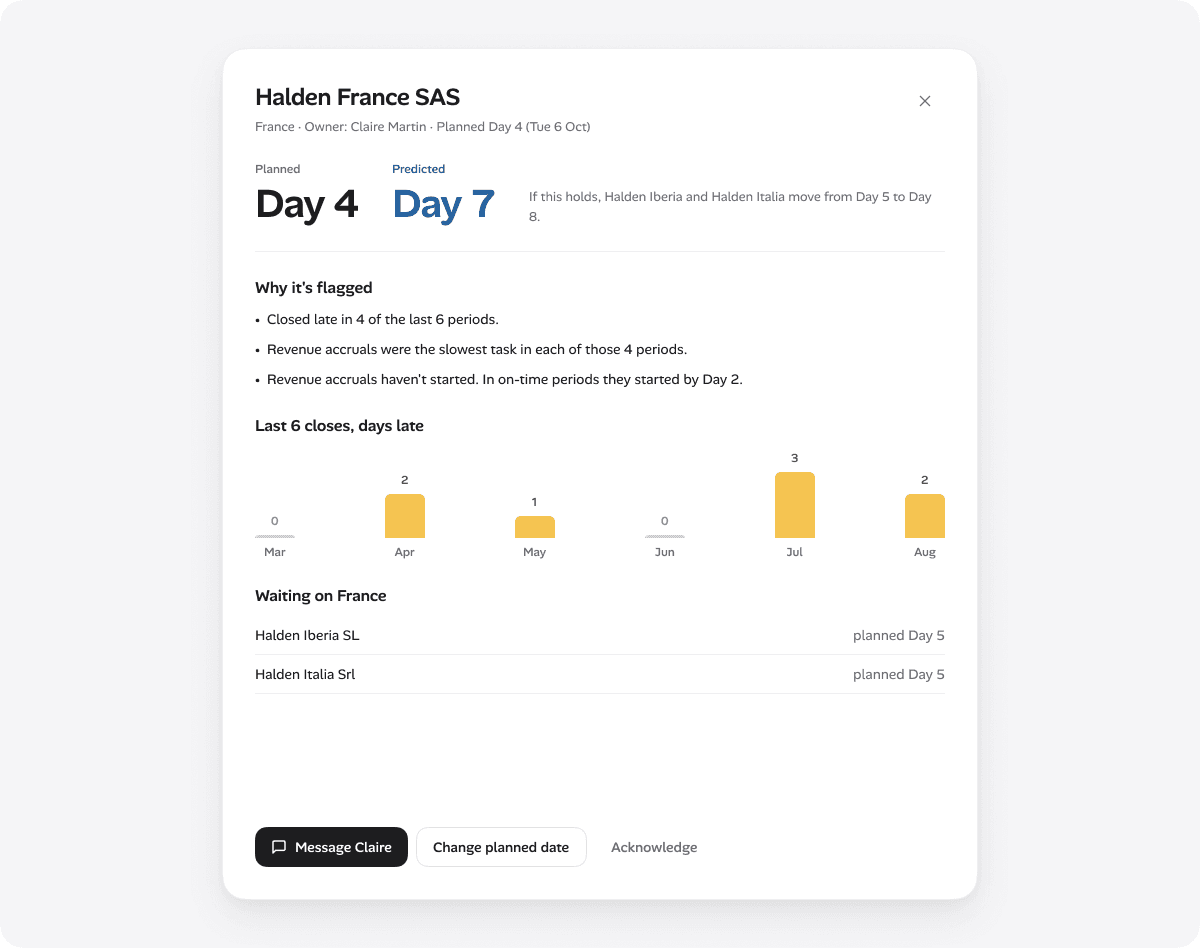
Each flagged entity gets one sentence explaining why. Show planned vs. actual close date side by side, so the problem is clear. History is there if they want it.

Entity panel showing planned vs. predicted close day, the reasons behind the flag, and close history

Show dependencies only for entities that matter

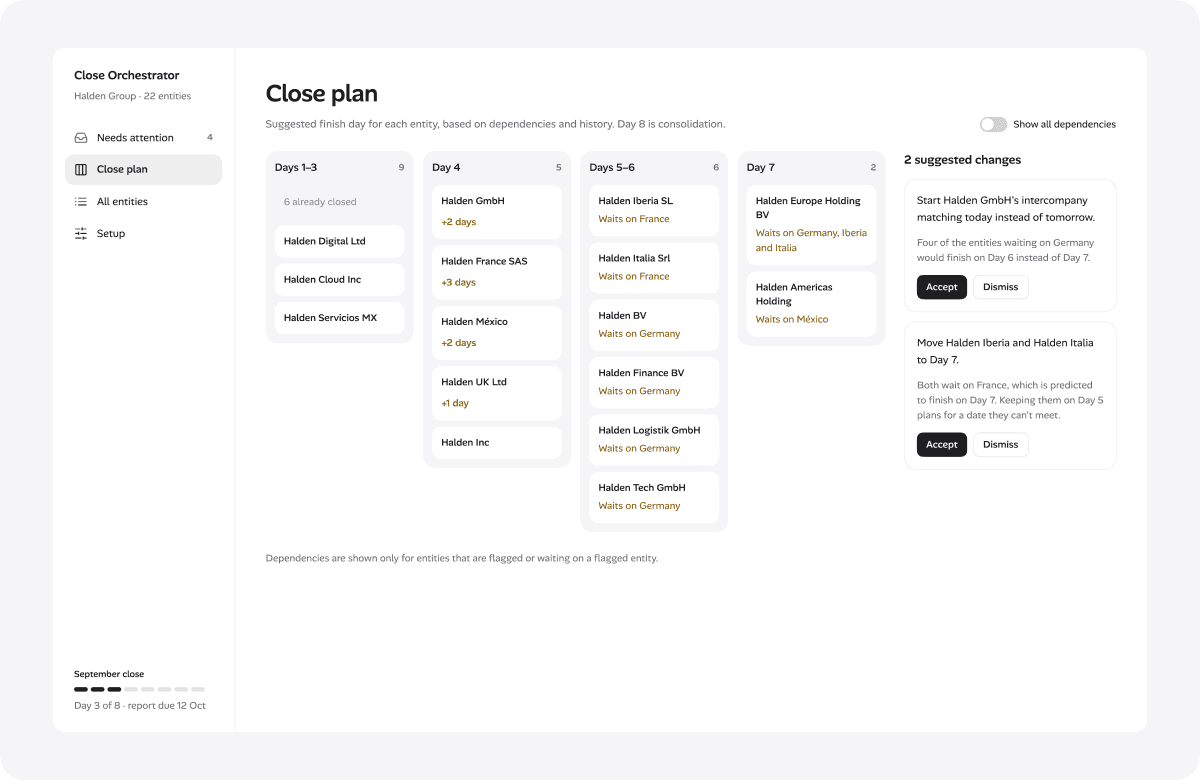
The close plan groups entities by their target finish day. Dependency lines only appear between flagged entities and the ones waiting on them. Everything else stays quiet. Closed entities collapse to a single line. This keeps the mental load reasonable.

Close plan grouping entities by planned finish day, with dependency information only on flagged entities

Accountants get told who needs them, not that they're late

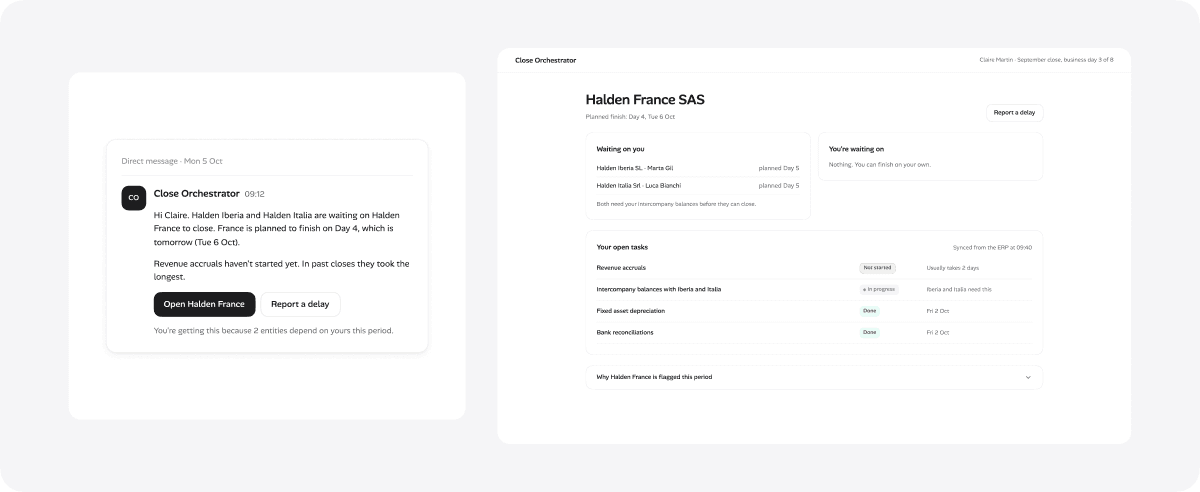
The accountant's message says which other entities depend on theirs and by when. It's about obligation, not blame. The flag and reason are available but not the headline. Saying 'you're late' doesn't help. Saying 'team B needs you by Thursday' does.

Entity accountant notification and My entity view, framed around who is waiting rather than blame
Hiding entities means betting on the prediction

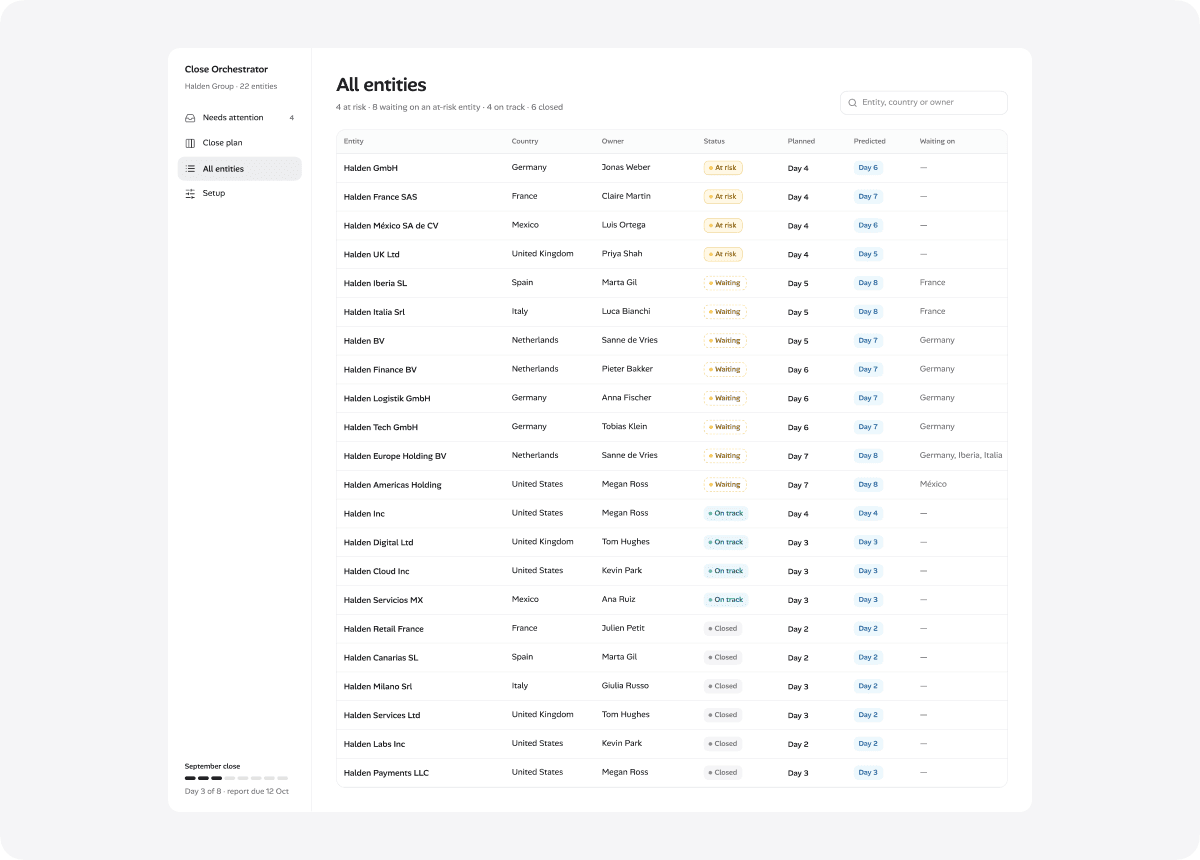
By showing only flagged entities, the controller must trust the model. The main screen says how many aren't flagged and their status. The full list is one click away. The controller sets the risk threshold themselves.

All entities screen, one click away from the main needs-attention list
Color only where it means something

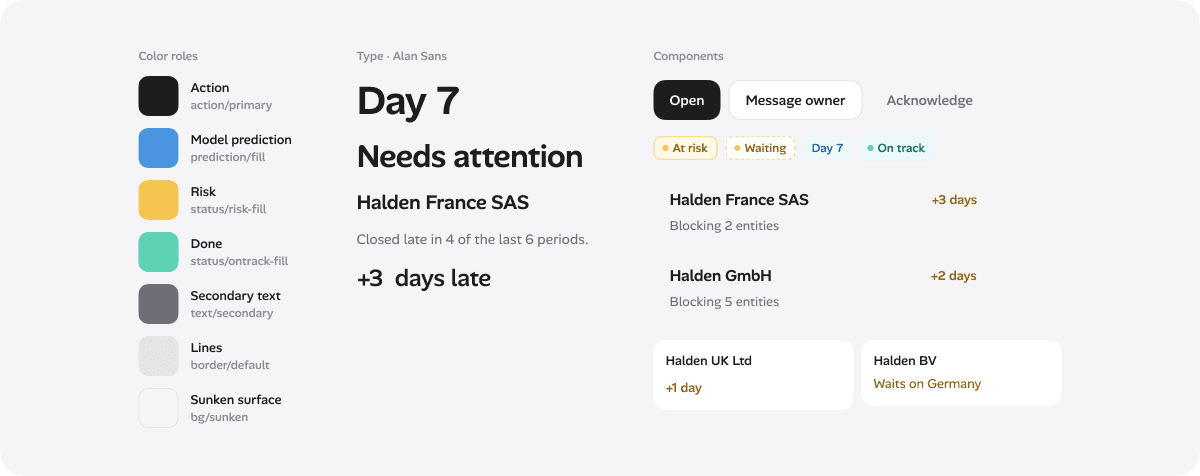
Three-layer token system: primitives, named roles, component tokens. Blue means 'the model flagged this', amber means 'at risk', mint means 'complete'. Everything else stays white and gray. Color is information, not decoration.

Design system reference sheet: color roles, type scale, and components used across Close Orchestrator